Bert Willard 2/2/26
#BertWillard #MarketResearch #HumanOriginAIAssisted #PrivateEquity #InvestmentStrategy #Manufacturing #SupplyChain #EnergyTransition #Infrastructure #AI #IndustrialSupercycle #GridModernization #DataCenterInfrastructure #EnergyInvesting #EngineeredSolutions #OperationalDueDiligence #PowerGeneration #2026Outlook #LiquidCooling #Reshoring #CriticalMinerals
Executive Summary: The Convergence of Power and Production in the 2026 Supercycle
As the global economy advances into the first quarter of 2026, a structural transformation is reshaping the industrial landscape. We are witnessing the definitive convergence of the energy sector with critical infrastructure. This shift is driven by a “trilemma” of macroeconomic forces. It includes the aggressive re-industrialization of Western economies. There is an exponential surge in power demand from Artificial Intelligence (AI) data centers. Additionally, there is a capital-intensive energy transition toward decarbonization. This convergence has fundamentally altered the investment thesis for industrial manufacturing. Companies that were once categorized into distinct verticals—generating power, managing grids, or building factories—have coalesced into a unified “energy-industrial” ecosystem. In this new paradigm, the manufacturer of a gas turbine is integral to the digital economy. It holds the same importance as the semiconductor fabricator. The producer of a high-voltage transformer holds the keys to national security.
The distinction between “energy” and “infrastructure” has blurred to the point of irrelevance. Industrial manufacturers give engineered solutions across these domains. They are no longer merely equipment vendors. They have become critical path providers for economic competitiveness. The current market state is defined by an acute imbalance between supply and demand. The backlog for critical engineered assets has reached historic levels. Lead times for essential components like Large Power Transformers (LPTs) are stretching beyond four years. This scarcity has created a seller’s market. It is characterized by extraordinary pricing power and selective bidding. There is also a focus on high-margin, complex engineering projects instead of commoditized volume.
For investment groups, this environment presents a complex challenge. The “easy” beta trade of simply buying industrial indices may have passed. The alpha now lies in identifying specific bottlenecks. It also involves understanding technical differentiation and navigating fragile global supply chains. This report serves as a comprehensive guide for such an investigation. It dissects the sub-sectors of this converging market. It maps the perilous supply chains that underpin them. It also profiles the major players who are capitalizing on the 2026 boom. Furthermore, it uses the perspective of an expert energy researcher to outline a rigorous due diligence framework. This demonstrates how deep technical and regulatory knowledge can be weaponized. These insights are used to assess commercial viability and operational resilience in an era of volatility.


1. Sector Taxonomy: Defining the Industrial-Energy Nexus
To allocate capital effectively, one must first dismantle the broad and often misleading categorization of “Industrials.” The specific investment opportunity lies at the precise intersection where Advanced Manufacturing meets Critical Infrastructure. This sector is not characterized by the mass production of interchangeable commodities. Instead, it focuses on the fabrication of highly engineered, capital-intensive assets. These assets generate, transmit, or manage energy for industrial and utility applications.
1.1 The Architecture of Engineered Solutions
The “engineered solutions” market operates on a fundamentally different cadence than general manufacturing. It is primarily an Engineer-to-Order (ETO) or Configure-to-Order (CTO) environment. This distinction is crucial for investors. It implies different working capital cycles. It also suggests varying revenue recognition models and risk profiles. These businesses are characterized by high barriers to entry. They often require decades of proven reliability records. They possess deep intellectual property moats and long-term service tailwinds. This provides recurring revenue long after the initial sale.
We can segment this vast industrial apparatus into three primary tiers based on the final application of the technology. Each tier represents a distinct entry point for investment, with unique drivers and constraints.
Tier 1: Power Generation & Prime Movers
This sub-sector involves the manufacturing of heavy rotating equipment used to convert primary fuel sources into mechanical or electrical energy. It is the “heart” of the energy system.
- Heavy-Duty Gas Turbines (HDGT): These are the backbone of modern grid stability. In 2026, the narrative around gas turbines has shifted from “transitional asset” to “critical reliability asset.” They are essential for firming the intermittency of renewable energy and providing the 24/7 baseload power required by data centers. The manufacturing focus has moved toward high-efficiency combined cycle units and “hydrogen-ready” turbines capable of blending clean fuels. The market is dominated by an oligopoly, as the metallurgical science required to build blades that withstand temperatures higher than the melting point of the metal itself creates an immense moat.
- Small Modular Reactors (SMR) & Nuclear Components: While still a nascent market compared to gas, the manufacturing of pressure vessels, steam generators, and modular containment structures for next-generation nuclear energy is accelerating. This sub-sector represents a longer-duration play on carbon-free baseload power.
- Reciprocating Engines: These provide distributed power generation and backup reliability. Unlike massive turbines, these are often deployed in clusters for industrial sites, hospitals, and increasingly, behind-the-meter data center applications. The manufacturing process here resembles heavy automotive production but with significantly higher tolerances and durability requirements.


Tier 2: Grid & Transmission Infrastructure
If generation is the heart, the transmission grid is the vascular system. This sub-sector is currently the most constrained point in the global energy supply chain and arguably the single largest bottleneck to economic growth in 2026.
- Large Power Transformers (LPTs): These massive devices, often weighing hundreds of tons, are essential for stepping voltage up for transmission and down for distribution. They are bespoke machines, custom-wound for specific grid nodes. The manufacturing process is labor-intensive and material-constrained, leading to the current crisis in availability.
- High-Voltage Switchgear & Breakers: These are the safety mechanisms of the grid, designed to interrupt massive electrical faults to prevent catastrophic failure. Modern manufacturing in this space is transitioning away from SF6 (a potent greenhouse gas) to eco-efficient alternatives, driving a replacement cycle that requires new production lines and engineering standards.
- High-Voltage Direct Current (HVDC) Converters: Specialized equipment for long-distance renewable energy transport (e.g., offshore wind to shore). The manufacturing of the power electronics modules (IGBTs) and the massive converter valves is a highly specialized niche dominated by a handful of global players.
Tier 3: Industrial & Data Center Infrastructure
This tier encompasses the “balance of plant” and critical infrastructure within the facility fence line. It is where energy connects to the load.
- Thermal Management (Cooling): This sub-sector has exploded in importance due to the thermal density of AI processors. We are witnessing a manufacturing pivot from traditional CRAC (Computer Room Air Conditioning) units to advanced Liquid Cooling and Immersion Cooling systems. These are complex engineered fluid dynamic systems involving coolant distribution units (CDUs), manifolds, and specialized cold plates.
- Power Distribution Units (PDUs) & UPS: The “last mile” of power within a facility. The manufacturing of Uninterruptible Power Supplies (UPS) involves integrating battery chemistries with sophisticated power electronics. The trend is toward modular, prefabricated electrical rooms (skids) that can be dropped onto a site.
Industrial Drives & Motors: The workhorses of the manufacturing economy. Variable Frequency Drives (VFDs) and high-efficiency motors are critical for reducing the energy intensity of industrial processes. This sector is heavily influenced by energy efficiency regulations and the automation of factory floors.


1.2 Business Models: OEM vs. EPC vs. EPC Manufacturing
For an investor, distinguishing between the types of businesses operating in this space is as important as the technology itself. The sector generally operates through three distinct, though sometimes overlapping, models. Understanding which model a target company employs is crucial for assessing risk and valuation multiples.
- Original Equipment Manufacturer (OEM): Companies like GE Vernova, Siemens Energy, or Mitsubishi Heavy Industries fall into this category. They design, engineer, and build the core technology (e.g., the gas turbine, the compressor, the transformer).
- Investment Profile: High R&D operational expenditure (OpEx), high capital expenditure (CapEx) for factories. However, they command the highest margins on aftermarket services. A gas turbine sold today generates service revenue for 30 years. The primary risks are supply chain management, technology failure, and the cyclicality of capital spending.
- Engineering, Procurement, and Construction (EPC): Companies like Jacobs Solutions or Quanta Services largely do not manufacture the equipment. Instead, they design the overall facility, procure the equipment from the OEMs, and manage the construction risk.
- Investment Profile: These are “asset-light” businesses compared to OEMs. Their value proposition is project management, labor force mobilization, and risk transfer. They operate with lower gross margins but can generate high Return on Invested Capital (ROIC) due to low asset bases. Their risk lies in fixed-price contract execution and labor shortages.
- EPC Manufacturing (The Hybrid Model): A rising trend in 2026 is the “productization” of infrastructure. This involves pre-fabricating modular infrastructure—such as modular data centers, skid-mounted substations, or containerized power plants—in a controlled factory setting before shipping them to the site.
- Investment Profile: This model captures the best of both worlds. It offers the scalability and quality control of manufacturing with the project-delivery value of an EPC. By moving construction hours from the field (expensive, variable) to the factory (controlled, cheaper), these companies reduce project risk and accelerate timelines. This is a key value driver in the current market where speed-to-market is the primary KPI for customers like hyperscalers.
2. Supply Chain Analysis: Anatomy of a Constraint
The strategic value of the industrial manufacturing sector in 2026 is strictly defined by scarcity. The global supply chain for energy infrastructure is rigid and geographically concentrated. It is currently overwhelmed by a concurrent demand shock from multiple sectors. At its core, an investment thesis in this space is a wager on supply chain arbitrage. It involves betting on the companies that have secured access to critical inputs.
2.1 Critical Material Inputs: The Building Blocks of Scarcity
The manufacturing of transformers, turbines, and motors relies on a specific set of niche metallurgical and chemical inputs that are difficult to substitute and slow to scale.
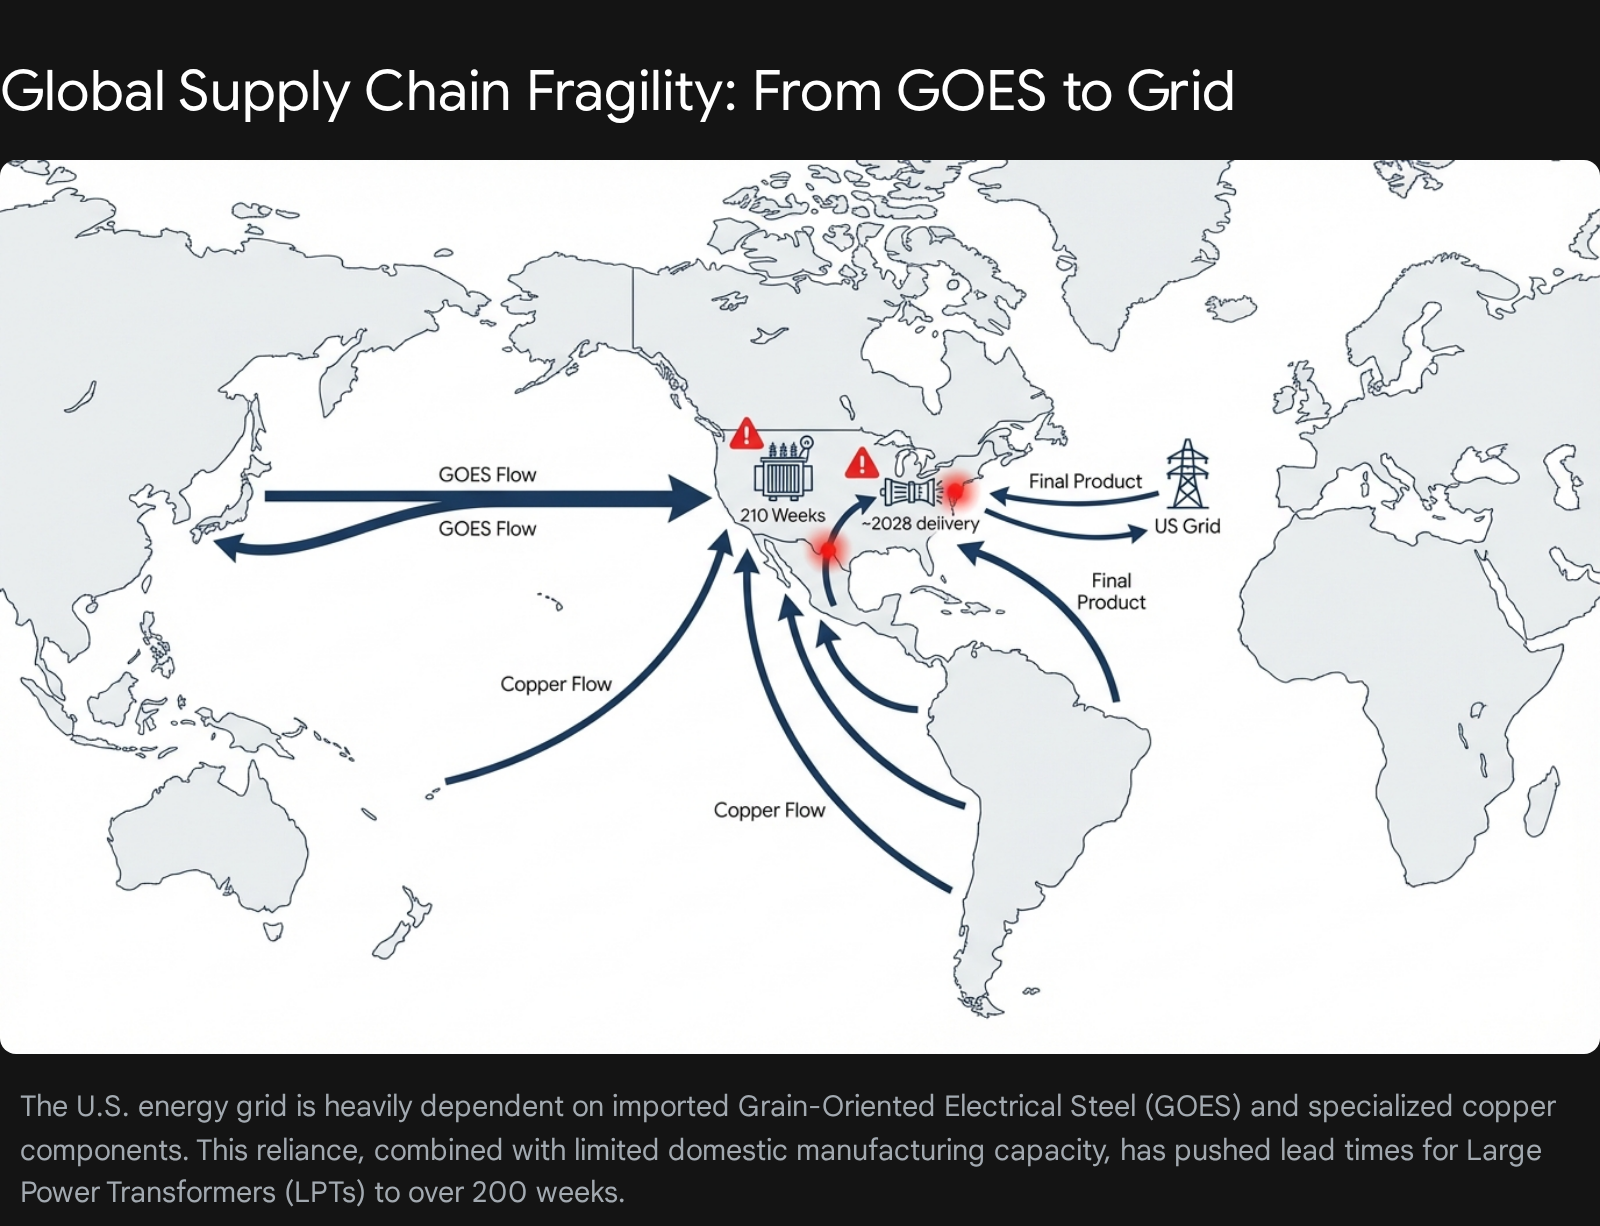
- Grain-Oriented Electrical Steel (GOES): This is the single most critical bottleneck for the global power grid. GOES is a highly specialized cold-rolled steel product with a grain structure aligned to permit the easy flow of magnetic fields. It is the essential core material for transformers; without it, voltage cannot be stepped up or down efficiently.
- The Constraint: The production of GOES is technically demanding and capital intensive. As of 2026, there is only one significant domestic producer in the United States (Cleveland-Cliffs), leaving the North American market heavily dependent on imports. The primary global suppliers are located in Japan (Nippon Steel, JFE Steel), South Korea (POSCO), and China (Baosteel).
- Market Dynamic: Trade barriers and tariffs complicate this reliance. Section 232 tariffs and anti-dumping duties create a complex pricing environment. Manufacturers who have secured long-term offtake agreements with the few remaining GOES mills hold a massive competitive advantage. Those relying on the spot market are often unable to quote competitive lead times.
- Copper: While often viewed as a commodity, the copper required for energy infrastructure is highly specialized. Large power transformers and industrial motors require high-grade Enamelled Copper Wire (magnet wire). The winding of this wire is a precision process. While raw copper is mined globally (Chile, Peru, DRC), the capacity to refine and process it into high-purity electrical grades is a distinct industrial constraint.
- Specialized Castings & Forgings: Gas turbines and large generators require massive steel forgings for rotor shafts and single-crystal nickel superalloy castings for turbine blades. The supply base for these components has consolidated over the last two decades. There are very few foundries globally (e.g., Japan Steel Works, Sheffield Forgemasters) capable of pouring ingots of the size and quality required for a 300MW+ gas turbine. A failure or delay at one of these foundries ripples through the entire OEM ecosystem.
Critical Minerals (Lithium, Cobalt, Rare Earths): For the battery storage and permanent magnet motor sub-sectors, the supply chain is inextricably linked to the geopolitics of critical minerals. Despite efforts to diversify, the refining capacity for these materials remains heavily concentrated in China. This creates a “sovereign risk” premium for manufacturers who cannot demonstrate a diversified supply chain to Western buyers.


2.2 The “Transformer Crisis” and Turbine Backlog
The culmination of these material constraints and demand shocks has led to a market environment in 2026 that can best be described as a “super-cycle” of scarcity.
- The Transformer Cliff: Lead times for Large Power Transformers (LPTs) have extended dramatically, moving from a historical norm of roughly 80 weeks in 2020 to over 210 weeks (roughly 4 years) in 2026. This is not merely an inconvenience; it is a hard stop on development. Renewable energy projects cannot interconnect, and data centers cannot come online without these assets. Consequently, manufacturers are effectively sold out for years. This grants them immense pricing leverage, allowing them to demand favorable payment terms (high down payments) and price escalation clauses that shift raw material risk to the buyer.
- The Gas Turbine Renaissance: The realization that renewables alone cannot support the 24/7 load profile of AI data centers has led to a scramble for firm power. Major OEMs like GE Vernova and Siemens Energy are witnessing a resurgence in orders for heavy-duty gas turbines. The book-to-bill ratios for these segments are exceeding 1.4x, indicating that the backlog is growing faster than production. New unit deliveries are now pushing into late 2028 and 2029. The constraint here is not just physical manufacturing capacity—which is difficult to expand due to the skilled labor required—but the limited number of “slots” available in the production schedule. This has created a secondary market for “production slots,” where developers trade their place in line at a premium.
3. Major Players: The 2026 Landscape
The market is dominated by a mix of diversified industrial giants, who have often spun off their energy divisions to unlock value, and specialized pure-play entities. Below is a detailed analysis of the top 10 players driving this sector as of January 2026. These entities were selected based on their market share, strategic relevance to the energy/infrastructure convergence, and recent capital deployment.
3.1 Company Profiles and Strategic Positioning
1. Siemens Energy (Ticker: ENR, HQ: Germany/USA)
- Strategic Focus: As a pure-play energy technology company, Siemens Energy covers the entire value chain from power generation (Gas Services) to transmission (Grid Technologies) and renewables (Siemens Gamesa).
- 2026 Status: The company is in a phase of aggressive expansion, particularly in the United States. Recognizing the “transformer crisis,” Siemens Energy has committed $1 billion to expand manufacturing capacity in North Carolina, Florida, and Texas. This includes the production of large power transformers and grid stabilization technology.
- Financial Health: The company has successfully turned the corner on its wind turbine reliability issues and is now leveraging its massive backlog (exceeding €120 billion) to drive margin expansion. Their book-to-bill ratio remains consistently above 1.0, signaling sustained demand.
2. GE Vernova (Ticker: GEV, HQ: USA)
- Strategic Focus: The standalone future of GE’s energy businesses, GE Vernova is the market leader in heavy-duty gas turbines in the Americas. Its portfolio includes Gas Power, Wind (Onshore/Offshore), and Electrification (Grid Solutions).
- 2026 Status: GE Vernova is the primary beneficiary of the data center power boom. Its H-Class gas turbines are the preferred “prime mover” for large-scale, behind-the-meter generation projects. The company boasts a backlog equivalent to roughly 40GW of power capacity.
- Financial Health: As an independent entity, GEV has focused on discipline, prioritizing price over volume. This strategy has resulted in significant margin expansion, with EBITDA margins in its Power segment leading the industry.
3. Mitsubishi Heavy Industries (Ticker: 7011, HQ: Japan/USA)
- Strategic Focus: A diversified heavy industrial conglomerate with a dominant position in power generation systems. Mitsubishi Power Americas is their key vehicle for Western markets.
- 2026 Status: MHI is differentiating itself through a “technology pivot” toward hydrogen. They are aggressively marketing “hydrogen-ready” turbines and developing long-duration energy storage solutions (like the ACES Delta project in Utah). They are positioning themselves as the provider of choice for the “green molecules” value chain.
- Financial Health: Backed by the immense balance sheet of the wider MHI group, they have the resilience to fund large-scale R&D and pilot projects that smaller peers cannot risk.
4. Schneider Electric (Ticker: SU, HQ: France)
- Strategic Focus: Schneider describes itself as the specialist in energy management and automation. They operate at the intersection of the grid and the facility (Tier 3).
- 2026 Status: Schneider is the undisputed leader in low- and medium-voltage distribution and digital grid management. They have been ranked #1 in grid digitization technologies. Their “EcoStruxure” platform is the standard for managing the complex energy flows of modern data centers and microgrids.
- Financial Health: High recurring revenue from their software and digital services layers gives Schneider a valuation premium over traditional hardware OEMs.
5. Eaton (Ticker: ETN, HQ: Ireland/USA)
- Strategic Focus: Eaton is a power management company with deep exposure to the electrical sector. They are a critical supplier of electrical components, from the utility substation down to the breaker box in a home.
- 2026 Status: Eaton is a “secular winner” of the electrification trend. They are deeply integrated into the EV charging supply chain and the data center build-out. Their approach of providing “modular” solutions—pre-fabricated electrical assemblies—resonates with customers needing speed.
- Financial Health: Eaton consistently delivers strong free cash flow and has a robust balance sheet that supports strategic acquisitions to bolt on new technologies.
6. Vertiv (Ticker: VRT, HQ: USA)
- Strategic Focus: Vertiv is the closest thing to a “pure play” on AI physical infrastructure. They specialize in power, cooling, and IT infrastructure management for data centers.
- 2026 Status: Vertiv is riding the hyper-growth curve of liquid cooling. As chip densities rise, Vertiv’s specialized thermal management systems are becoming mandatory. Their growth rates significantly outpace the broader industrial sector, driven by hyperscale CapEx.
- Financial Health: After some supply chain stumbles in previous years, Vertiv has streamlined operations. They are currently showing some of the highest revenue growth rates in the sector, a direct reflection of the AI boom.
7. Hitachi Energy (Private, HQ: Switzerland)
- Strategic Focus: A global leader in high-voltage technology, particularly HVDC.
- 2026 Status: As offshore wind projects and long-distance transmission lines gain traction, Hitachi Energy’s HVDC Light® technology is essential. They are the “grid backbone” provider.
- Financial Health: As a subsidiary of Hitachi Ltd., they have significant resources. Their backlog is heavily weighted toward long-term, government-backed infrastructure projects, providing stability.
8. Jacobs Solutions (Ticker: J, HQ: USA)
- Strategic Focus: A premier technical professional services firm. Jacobs has pivoted aggressively away from general construction toward high-value advanced manufacturing (semiconductors, pharma) and critical infrastructure.
- 2026 Status: Jacobs is redefining the EPC model by offering “asset lifecycle” solutions. Their record backlog of $26.3 billion reflects strong wins in the data center and water sectors. They are the brains behind the complex integration of these facilities.
- Financial Health: Strong cash flow conversion allows for shareholder returns and strategic M&A (e.g., the PA Consulting stake).
9. Quanta Services (Ticker: PWR, HQ: USA)
- Strategic Focus: Quanta is the largest specialized contractor for electric power infrastructure in North America. They are the “boots on the ground” that install what the OEMs manufacture.
- 2026 Status: Labor is a constraint, and Quanta controls the largest skilled workforce in the industry. As utilities rush to harden grids and connect renewables, Quanta’s services are in high demand. They are a direct beneficiary of the IIJA spending.
- Financial Health: Quanta operates with lower margins than OEMs but creates value through volume and efficiency. Their revenue growth tracks closely with utility CapEx budgets.
10. Modine Manufacturing (Ticker: MOD, HQ: USA)
- Strategic Focus: Historically an automotive supplier, Modine has successfully transformed into a thermal management specialist.
- 2026 Status: Modine is a “niche specialist” aggressively taking share in the data center cooling market. They have repurposed their heat transfer expertise to build precision cooling systems for AI servers.
Financial Health: The market has re-rated Modine from an auto-parts multiple to a data-center-supplier multiple, reflecting the success of their strategic pivot.

3.2 Competitive Dynamics: The New Financial Paradigm
The sector is currently enjoying a structural period of “margin expansion.” Historically, these businesses were cyclical and suffered from commoditization. However, the current supply-demand imbalance has allowed OEMs to dictate terms.
- Pricing Power: Manufacturers are passing through 100% of raw material inflation and adding margins on top.
- Backlog Quality: It is not just the size of the backlog that matters (e.g., Siemens’ €120B+), but the quality. New contracts include inflation-protection indices and higher down payments, improving the cash conversion cycle.
- Growth vs. Profitability: The landscape is bifurcated. Companies like Vertiv and Eaton represent high-growth potential (~18-26% CAGR in specific segments like liquid cooling) coupled with expanding margins. In contrast, the massive incumbents like GE Vernova and Siemens Energy offer stability and scale, with steady growth (~5-7%) but enormous absolute cash generation potential from their installed base services.
4. Strategic Leadership & Human Capital
For investors conducting due diligence or seeking entry, connecting with the right functional leaders is paramount. The “C-Suite” sets the vision, but the “Heads of Sales” and “Business Development” control the order book and have the most accurate view of market reality.
4.1 Executive Leadership (Strategic Vision)
- Scott Strazik (CEO, GE Vernova): As the architect of GE’s successful spin-off, Strazik has deep credibility. He is the key figure for understanding the macro view of the gas turbine and wind markets and their role in the energy transition.
- Christian Bruch (CEO, Siemens Energy): Bruch is leading the massive US manufacturing expansion. He is a critical contact for insights into the transatlantic energy trade, the mechanics of the “Energiewende,” and the realities of grid modernization.
Giordano Albertazzi (CEO, Vertiv): The central figure in the data center infrastructure boom. His insights drive the industry narrative on AI thermal management and the partnership models between infrastructure providers and hyperscalers.
4.2 Commercial & Functional Leaders (Tactical Execution)
These individuals manage the pipelines and have real-time visibility into pricing, capacity, and customer behavior.
- Pablo Koziner (Chief Commercial Officer, GE Vernova): Koziner leads enterprise strategic growth and customer markets. He is the “gatekeeper” for large-scale power deals and a vital source for understanding cross-selling opportunities between wind, gas, and grid segments.
- Agustin Tenorio Bilbao (Grid Growth Program, Siemens Energy): Responsible for grid technology growth. He is a key contact for understanding the granular details of the transformer bottleneck, the expansion of manufacturing lines, and the talent acquisition challenges in the sector.
- Ty Remington (VP, Gas Power New Unit Sales, GE Vernova): Directly manages the sales of new gas turbines. He would have the most granular data on the “sold out” status of turbine slots, the pricing trends for new units, and the evolving requirements of utility customers.
- Scott Armul (Chief Product & Technology Officer, Vertiv): Leads the R&D and product strategy for data center infrastructure. He is the go-to expert for technical due diligence on liquid cooling technology trends, differentiating between direct-to-chip and immersion cooling viability.
- Heath Monesmith (President, Electrical Sector, Eaton): Manages the segment most exposed to electrification and data centers. His perspective on “strategic partnerships” versus transactional sales is vital for understanding how deep the relationships with hyperscalers truly go.
5. Investment Opportunity Assessment: Where is the Alpha?
If one were an investment entity looking to deploy capital in Jan 2026, the strategy should move beyond simply “buying the index” of major players. The true alpha lies in identifying specific sub-themes, supply chain inefficiencies, and “pick and shovel” plays that leverage the macro tailwinds.
5.1 The “Pick and Shovel” Play: Data Center Physical Infrastructure
While companies like NVIDIA and Microsoft capture the headlines for AI chips and software, the physical infrastructure required to run them is where the industrial alpha sits.
- The Opportunity: Liquid Cooling & Thermal Management. As rack densities in AI clusters exceed 50-100kW, traditional air cooling becomes physically obsolete. The shift to liquid cooling is not a preference; it is a thermodynamic necessity.
- The Play: Look beyond the giants. Focus on mid-market component suppliers that feed into companies like Vertiv and Schneider. Manufacturers of Coolant Distribution Units (CDUs), quick-disconnect couplings (essential for leak prevention), and specialized cold plates are high-value targets.
Forecast: The data center liquid cooling market is projected to grow at a Compound Annual Growth Rate (CAGR) of ~26% through 2035, reaching over $25 billion. This is a hyper-growth vertical nested within a mature industrial sector. In comparison, traditional sectors like gas turbines and transmission equipment are forecast to grow at a steady but lower rate of ~5-7%, reaching markets of ~$60B and ~$370B respectively. The velocity of capital is in cooling.

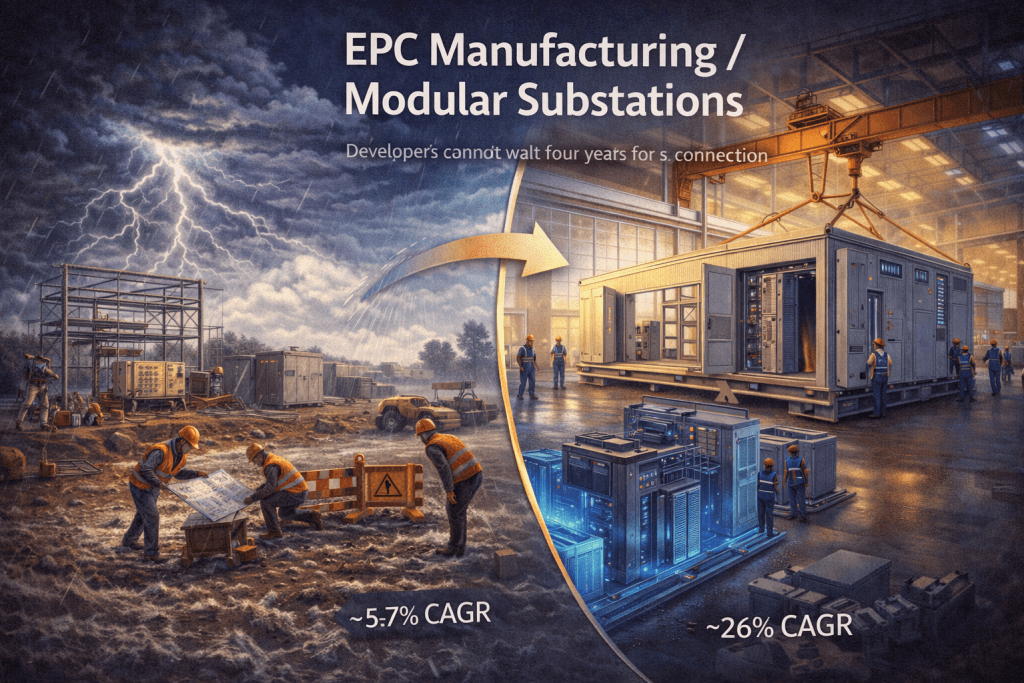
5.2 The “Grid Modernization” Play: EPC Manufacturing
The 200+ week lead time for traditional transformers creates a massive arbitrage opportunity for alternative solutions.
- The Opportunity: EPC Manufacturing / Modular Substations. Developers cannot wait four years for a connection. Companies that can pre-fabricate entire electrical rooms, substations (E-Houses), or skid-mounted switchgear in a factory bypass the on-site construction delays and weather risks.
- The Play: Companies employing this “productization” model, like Eaton and specialized modular fabricators, offer faster time-to-market. This capability commands a premium from data center operators and renewable developers who view speed as their primary currency.
- Catalyst: The backlog for traditional LPTs forces developers to seek medium-voltage alternatives or decentralized grid architectures, playing directly into the hands of modular solution providers.
5.3 The “Re-Shoring” Play: Domestic Manufacturing
Government incentives such as the Inflation Reduction Act (IRA) and the Infrastructure Investment and Jobs Act (IIJA) have fundamentally altered the economics of production, making domestic manufacturing profitable again.
- The Opportunity: US-based fabrication of critical components. Siemens Energy’s $1B investment in US capacity is a clear signal.
- The Play: Identify suppliers of raw materials (electrical steel, specialized copper wire) or niche fabricators located within the United States. These entities are protected by trade barriers (Section 232 tariffs) and “Buy American” mandates for utility infrastructure. They face less competition from low-cost imports and can charge a premium for “secure supply.”
Risk/Reward: Entry into this space requires high CapEx, but the moat is defended by federal policy and national security priorities.

6. How to Investigate: A Research Framework for the Energy Expert
For an investment group, standard financial analysis (P/E ratios, EBITDA margins) is necessary but insufficient for this sector. The risks are operational, technical, and regulatory. This is where an expert researcher in energy becomes an invaluable asset to the deal team.
The following framework outlines how to leverage deep domain expertise to conduct “second-level” due diligence that goes beyond the data room.
6.1 Commercial Due Diligence (CDD): Market & Customer Validation
The goal of CDD is to validate the “demand cliff” and the durability of the company’s competitive moat.
- Expert Insight Application:
- Validate “Spec-In” Status: A generalist investor checks if a company has revenue from Microsoft. An energy expert checks if the company’s equipment is specified in the “Reference Design” for Microsoft’s next-generation data centers. Being in the Approved Vendor List (AVL) is good; being in the reference design is a license to print money.
- Analyze the “Interconnection Queue”: Use FERC and ISO (PJM, ERCOT, CAISO) data to analyze the interconnection queue. A growing queue in a specific region signals future demand for the specific transformers and switchgear that the target company produces.
- Methodology:
- Expert Networks: Utilize firms (e.g., GLG, AlphaSights) to interview former procurement officers from large utilities (Duke, NextEra) or data center operators.
- Ask: “What is your tolerance for lead time delays?” “How much of a premium would you pay for a 50-week acceleration in transformer delivery?” “Are you shifting your standard design to accommodate modular skids?”
Win/Loss Analysis: Do not just look at revenue growth. Look at bid win rates. In a supply-constrained environment, a high win rate at high price points suggests true product differentiation and pricing power.


6.2 Operational Due Diligence (ODD): The Factory Floor
The goal of ODD is to validate the company’s ability to actually deliver on its record backlog without destroying margins.
- Expert Insight Application:
- Supply Chain “Forensics”: An energy expert knows that a transformer manufacturer is only as good as its supply of electrical steel.
- Investigation: Does the target have a secured, long-term offtake agreement with a mill like Cleveland-Cliffs or Nippon Steel? Or are they buying on the spot market? Review their purchase orders for index-linked pricing clauses that allow them to pass through commodity cost spikes.
- Capacity Headroom Analysis: Is the factory running at 100% utilization? If so, growth requires massive CapEx. Ideally, you want to find a target running at ~80% utilization with the ability to add a third shift.
- Red Flag: High reliance on manual labor in assembly. The “craft” of winding a transformer is hard to scale. Look for automation in core winding and assembly processes.
Technical Debt Check: As manufacturing becomes digitized, legacy IT systems are a liability. Assess the integration of their ERP (Enterprise Resource Planning) and PLM (Product Lifecycle Management) systems. A disjointed IT stack is a leading indicator of future delivery delays.
6.3 Regulatory & Technical Forecasting
- Expert Insight Application:
- Deciphering “Hydrogen-Ready”: Many OEMs claim their turbines are “hydrogen-ready.” An energy expert can audit these claims. Is it 100% ready? Or 30% blend ready? The difference impacts the asset’s terminal value in a decarbonized future.
- Policy Arbitrage: Analyze the target’s exposure to specific provisions of the IRA (e.g., 45X manufacturing credits). Calculate the direct bottom-line impact of these subsidies and assess the risk of policy repeal or modification.

7. Conclusion: The “Hard Tech” Renaissance
The industrial manufacturing sector within energy and infrastructure has transformed from a cyclical, commoditized market into a strategic growth engine. The “Industrial Supercycle” of 2026 is not a temporary bubble; it is underpinned by secular, non-cyclical demand drivers: the physical reality that Artificial Intelligence requires gigawatts of power, and that power requires tons of steel, copper, and engineered machinery.
For investors, the window of opportunity is open but narrowing. The “easy money” in buying large-cap incumbents may have been made; the next phase of alpha generation lies in identifying the bottlenecks—the specialized component manufacturers, the grid modernization innovators, and the infrastructure service providers who can execute in a resource-constrained world. By applying the rigorous commercial and operational due diligence frameworks outlined above—leveraging deep technical expertise to validate claims—investment entities can navigate the complexities of this re-industrialized landscape and capitalize on the infrastructure of the future. The convergence of energy and industry is the defining investment theme of the decade, and the winners will be those who understand the machinery as well as the markets.
Questions about the state of the energy markets? Reach out and let’s connect!
Sources
Macro Trends & Supply Chain Constraints
- Exiger: Strengthening Electricity Supply Chains. (Source for LPT lead times >200 weeks and GOES supply risks). Available here
- CISA / National Infrastructure Advisory Council (NIAC): Addressing the Critical Shortage of Power Transformers to Ensure Reliability of the U.S. Grid. (Source for transformer backlog data and national security implications). Available here
- U.S. Department of Energy: Electric Grid Supply Chain Report. (Mapping of the LPT and HVDC supply chain tiers). Available here
Company Performance & Strategic Investments
- Siemens Energy: Investment of $1 Billion to Expand U.S. Manufacturing Capabilities. (Source for Charlotte, NC and Mississippi facility expansion details). Available here
- E&E News: Siemens to spend $1B on expansion; GE Vernova and Mitsubishi Demand. (Source for GE Vernova’s 52% increase in orders and 40GW backlog data). Available here
- Jacobs Solutions: Fiscal First Quarter 2026 Results. (Source for $26.3B backlog and data center sector performance). Available here
- TIKR / Modine Manufacturing: Modine Manufacturing Analysis 2026. (Source for data center cooling revenue growth projections). Available here
Sector Forecasts & Technology
- Precedence Research: Data Center Liquid Cooling Market Size & Trends 2026-2035. (Source for market CAGR of ~18-26%). Available here
- Rocky Mountain Institute (RMI): Gas Turbine Supply Constraints Threaten Grid Reliability. (Analysis of turbine delivery backlogs extending to 2028). Available here
Leave a Reply